- Latest performance data shows the private market down in 2022, much like public markets
- Primary valuations are still increasing, though multiples are shrinking
- Mutual funds are marking down a majority of private issuers
Say it with us: it’s been a year.
Following a blisteringly positive 2021 for financial markets, 2022 has been more challenging for nearly every asset class. While many indices remain significantly below the peaks reached in 2021 — the Nasdaq Composite, for example, is roughly 30% off of its record high1 — public markets have shown resilience and the bottom has not fallen out.
A similar story is playing out in private markets. Although private market valuations often remain open to interpretation and move at a slower pace than publicly traded stocks, several indicators show that returns are softening but not nosediving since the public markets started their precipitous decline a year ago. Through the end of October, private company shares traded on the Forge platform at a 47% median discount to their last primary round, and discounts to the last primary have grown steadily since January of this year.2
Additionally, CalPERS, the largest public pension fund in the U.S., marked its private equity portfolio from $52.83 billion at the end of Q2 2022 to $48.84 billion at the end of Q3 — a near 8% drop. While this may be due to markdowns or reduced positions, it can be a lagging indicator given that GPs have 120 days to report financial data to LPs, as CalPERS explains.5 Meanwhile, the pension’s public equity portfolio essentially held steady during that period.
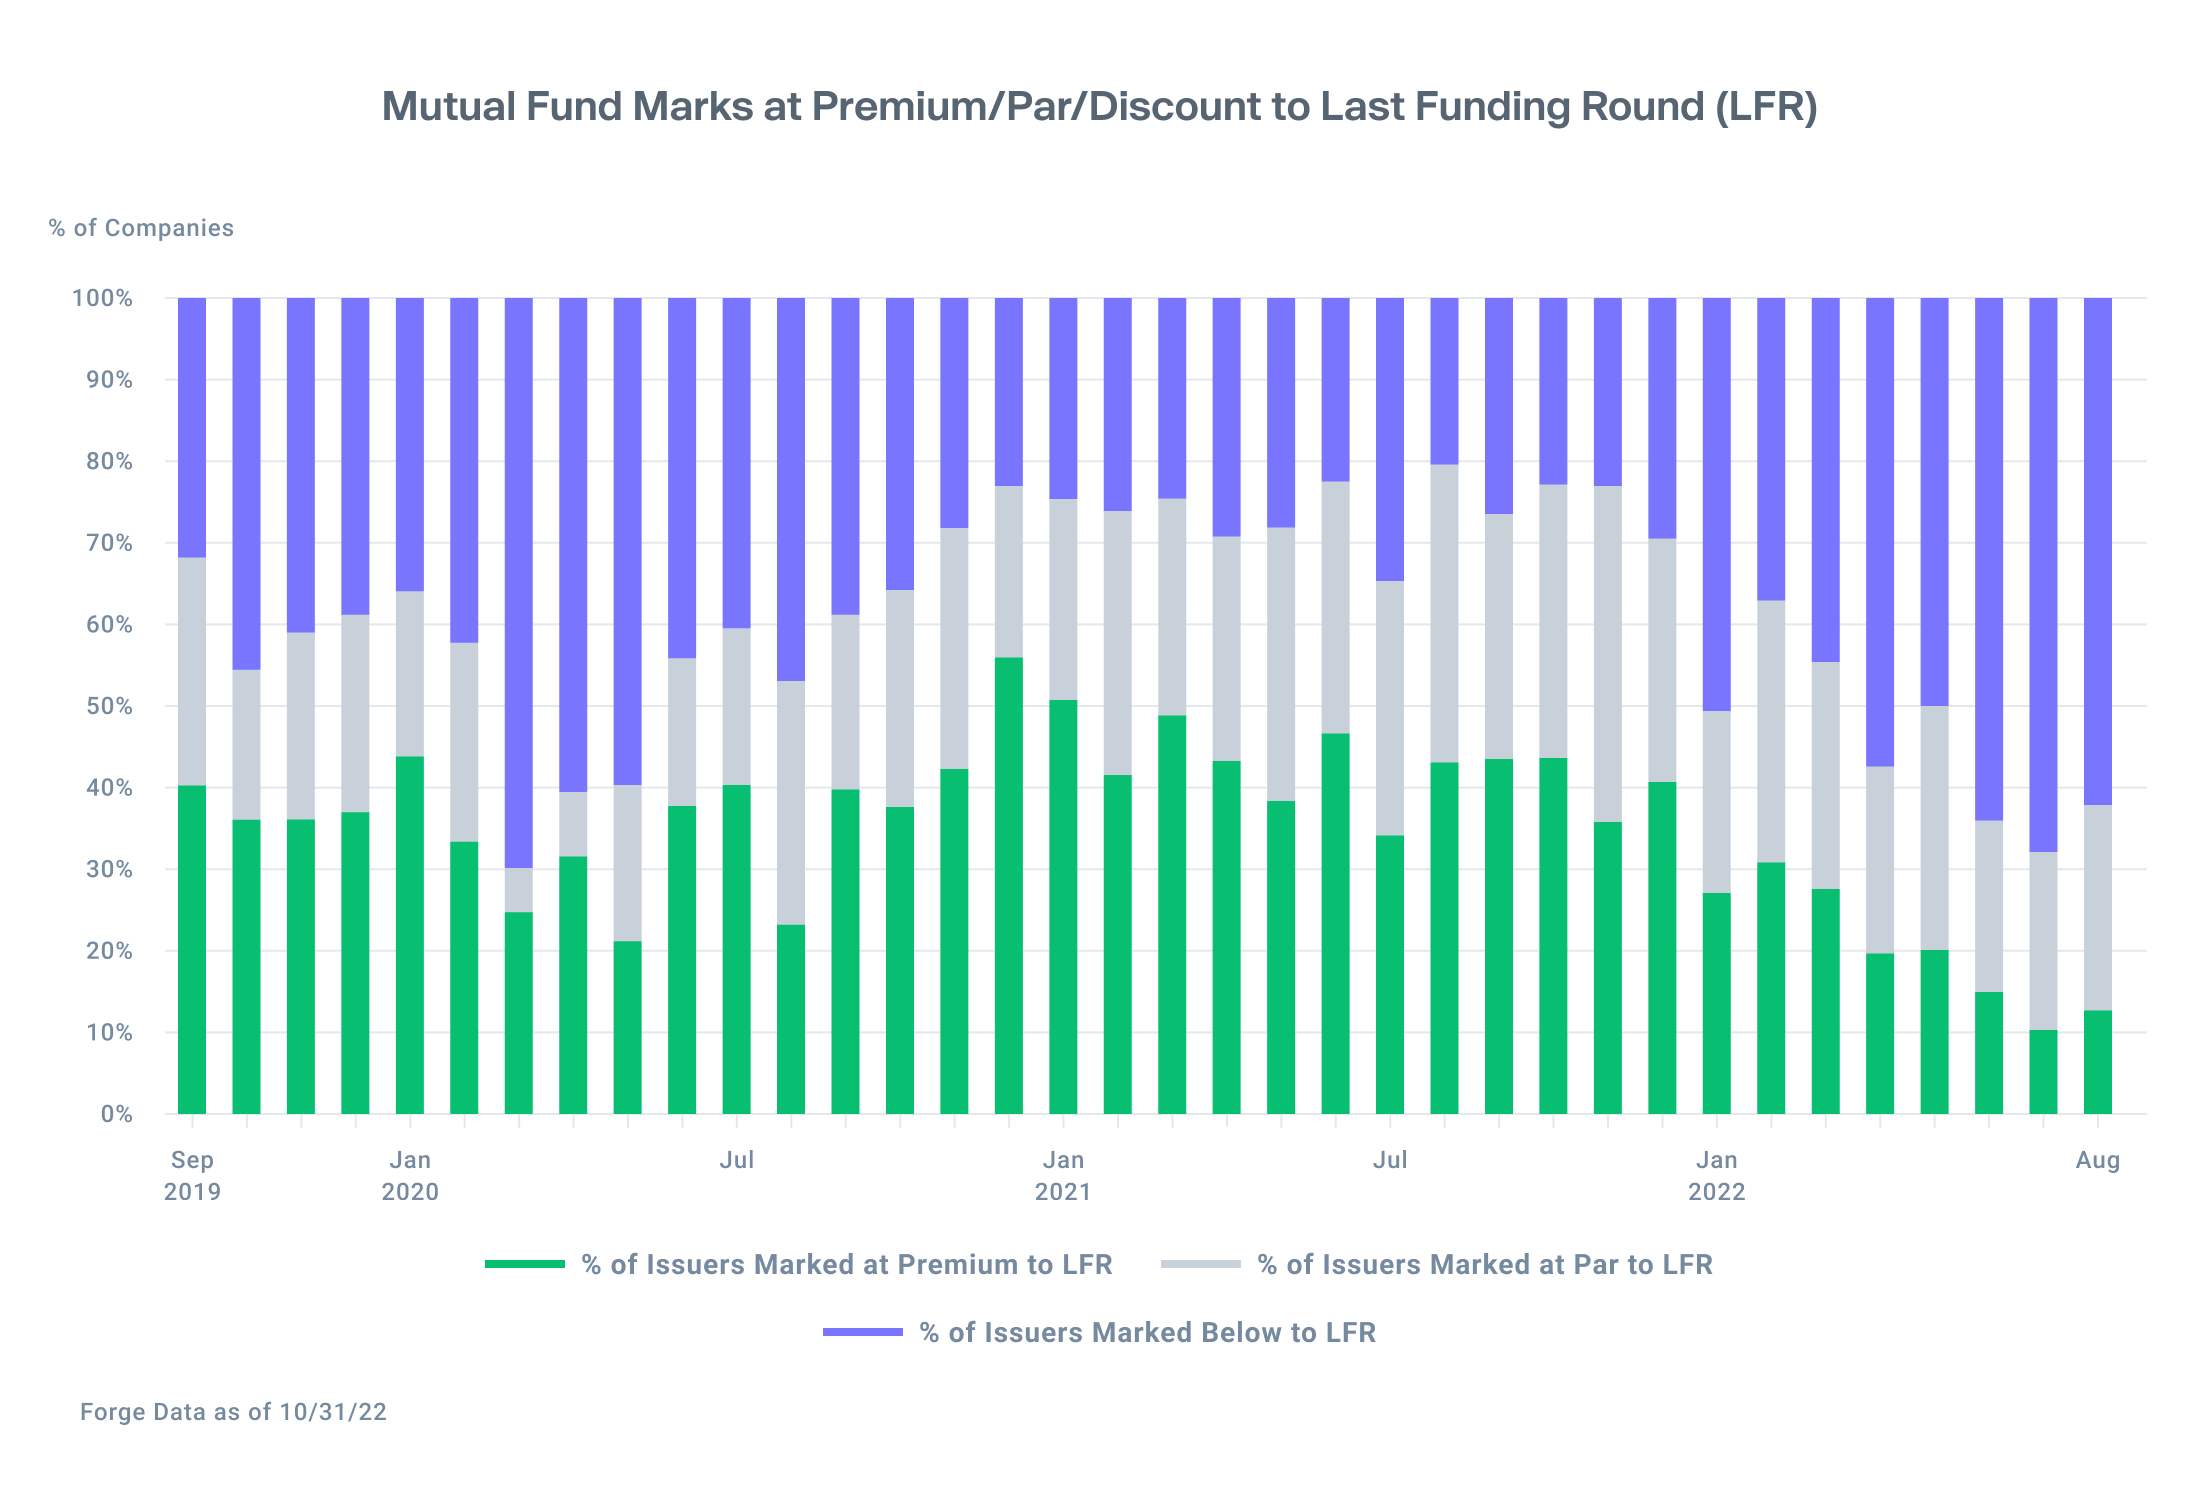
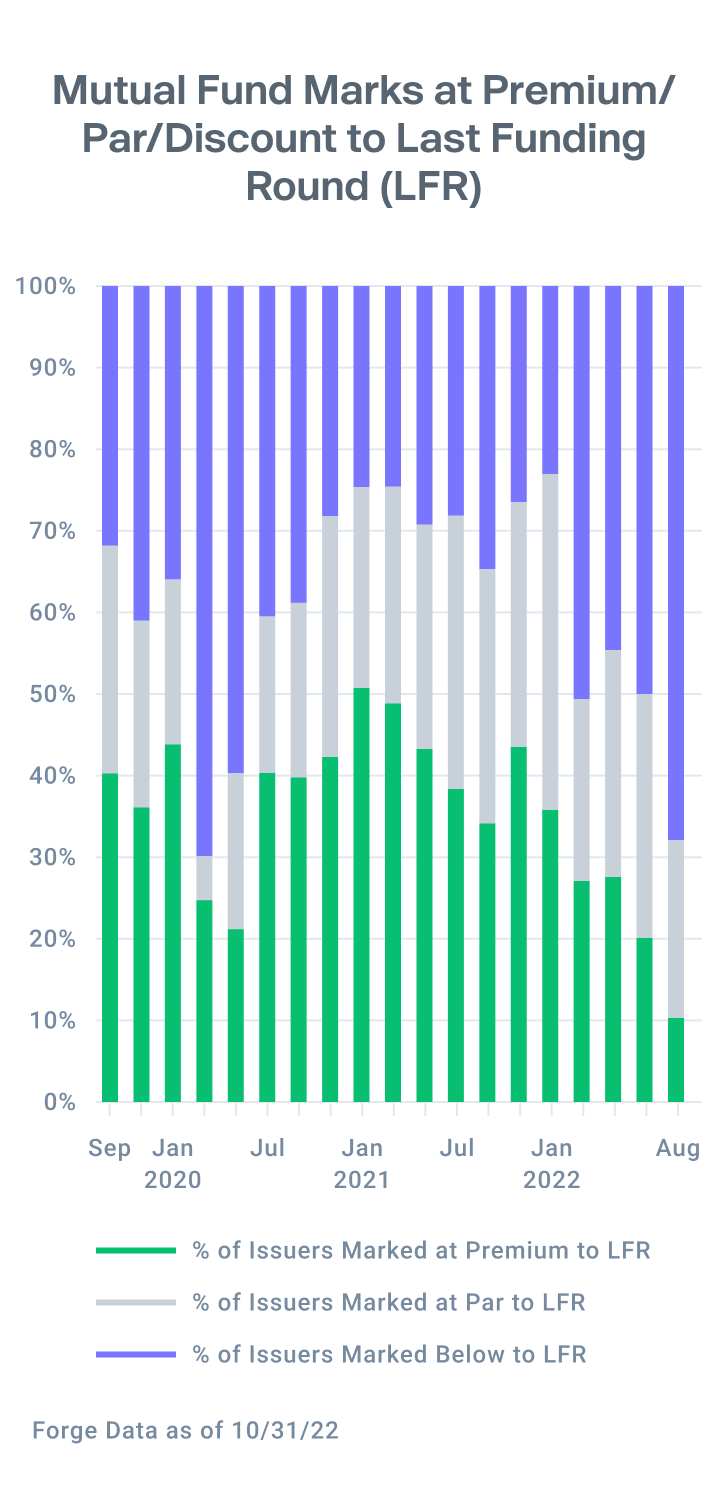
On a less anecdotal level, mutual funds managers can also provide insight. These investment giants must disclose their valuations for private holdings on a quarterly, if not monthly, basis, and many hold shares of the most prominent private tech companies. Whether they mark valuations up, down, or at par to companies’ last funding levels can indicate which way the wind is blowing. These managers marked 62% of companies at a discount to their last funding round in Q3 2022.6
As we round the corner into 2023, private market investors will no doubt keep one eye on macroeconomic indicators like inflation, interest rates, and earnings – while keeping another on valuations, sectors, and trends that propel this space.
If the broader economy manages a soft landing, private markets may rebound and be poised for a strong year ahead.
Private Market companies perform similarly to Public Market technology companies
In April 2021, the Bureau of Labor Statistics reported the U.S. economy’s largest rise in price inflation since the global financial crisis. Investors took notice but didn’t meaningfully alter their behavior.
Over the next six months, inflation measurements continued rising – and so did equities. In November of 2021, the NASDAQ 100 (QQQ) index reached an all-time high before opening 2022 with the start of what has been nearly a year-long selloff.
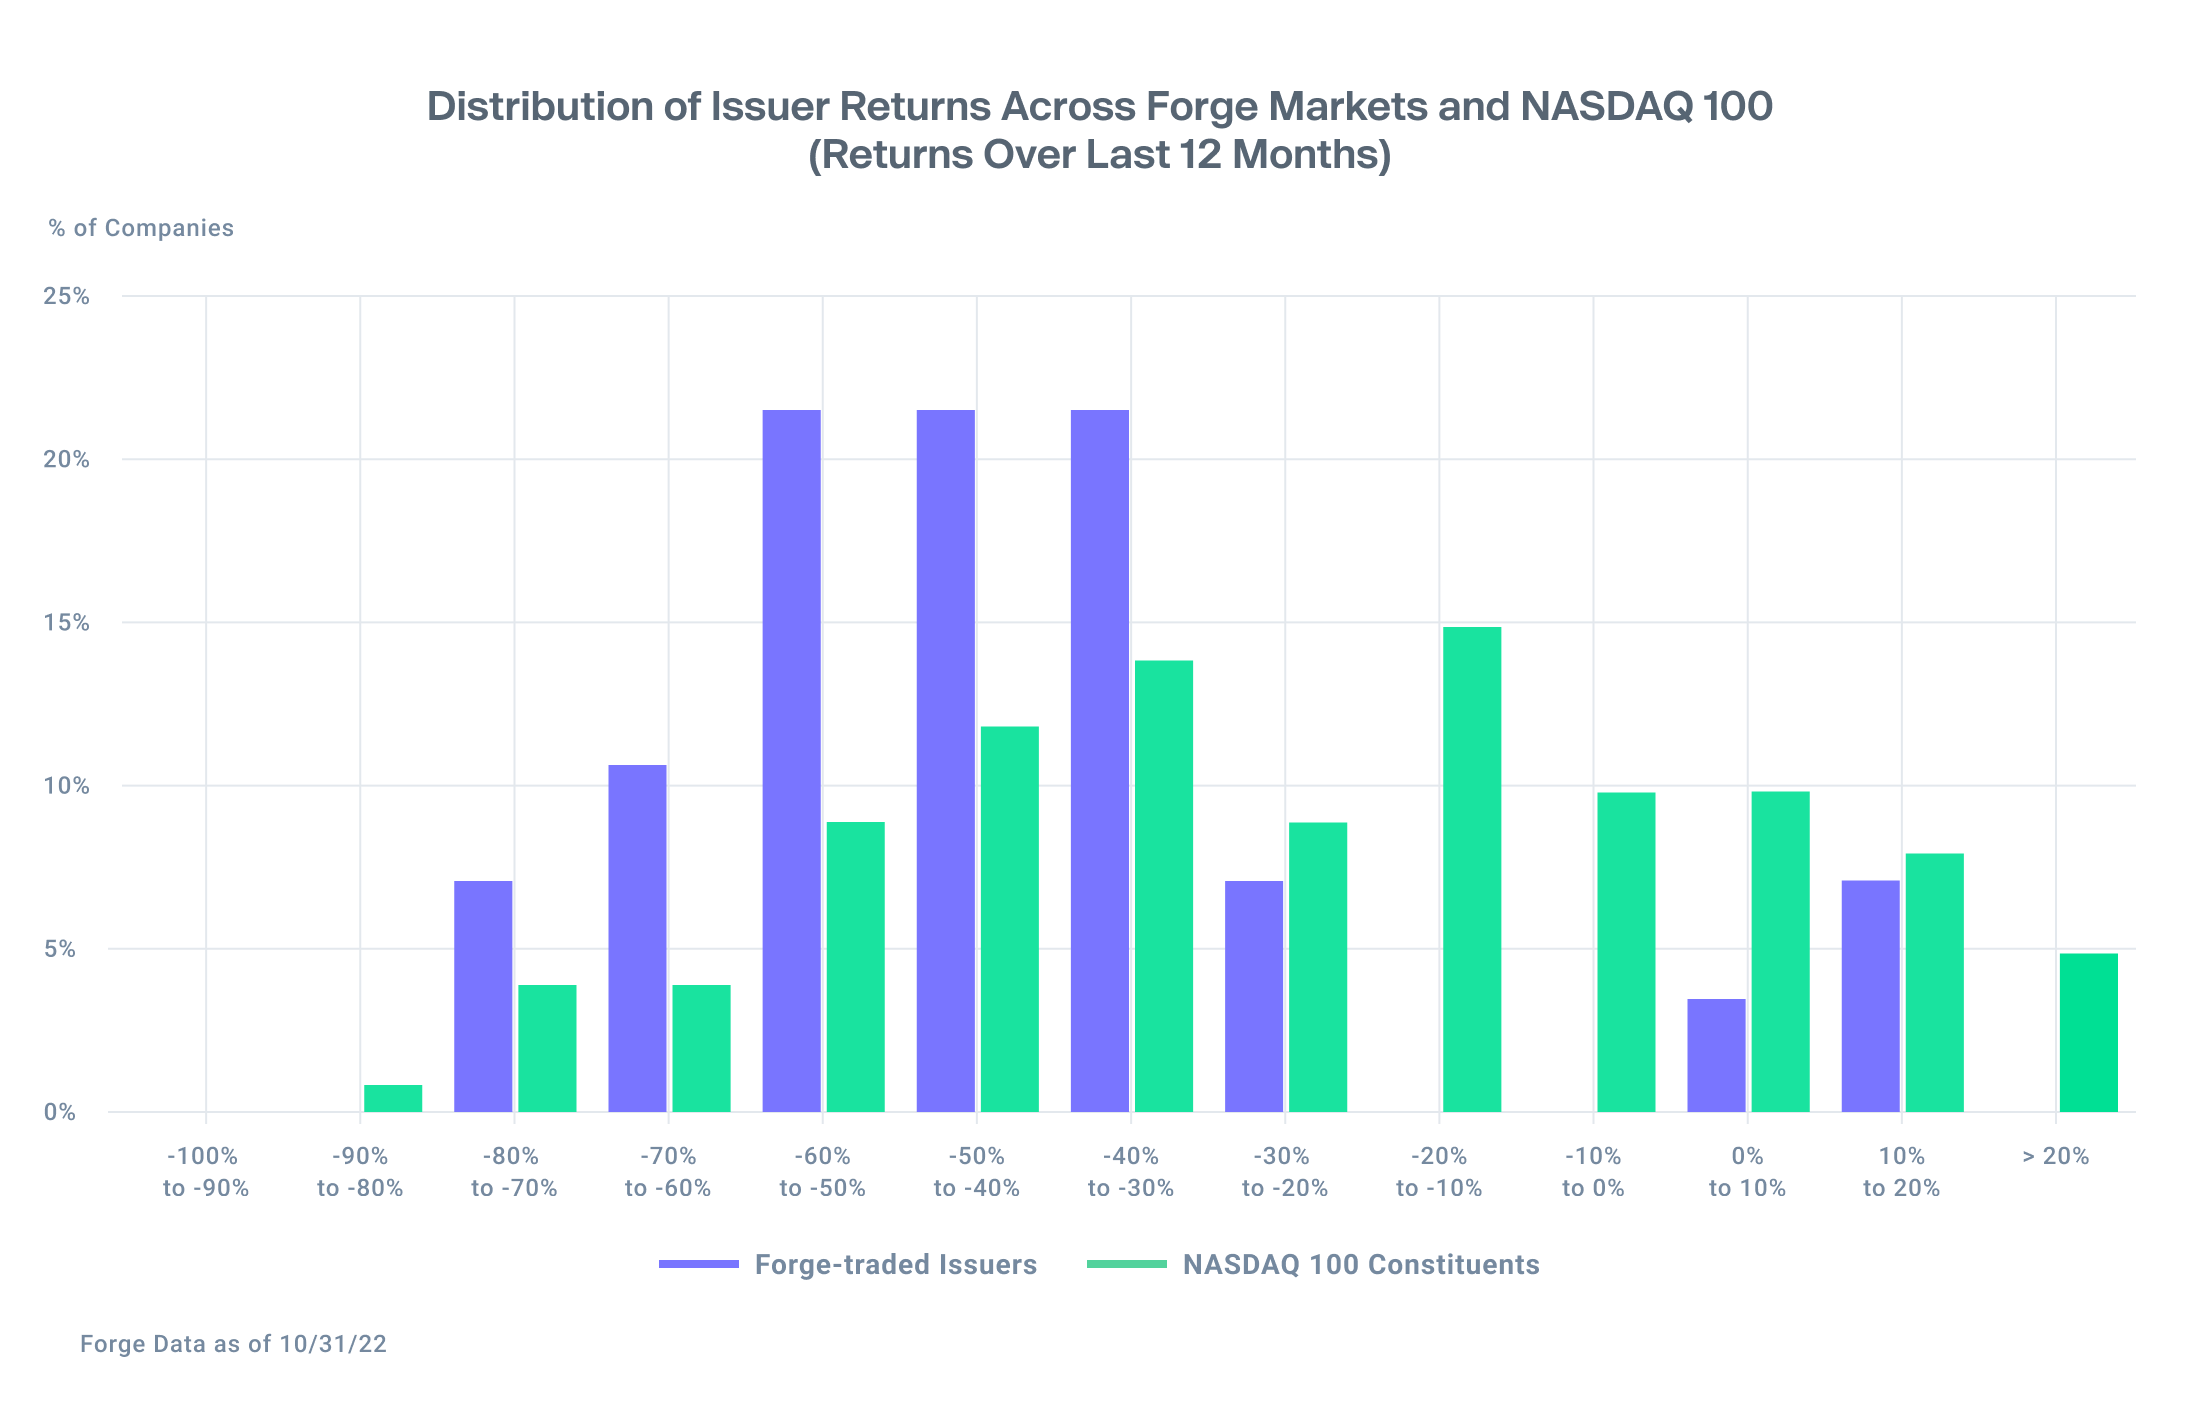
Companies that trade on Forge Markets may share similar qualities with those on the NASDAQ. In fact, some of the NASDAQ 100 constituents traded on Forge before going public, such as DocuSign, Okta, and Airbnb.
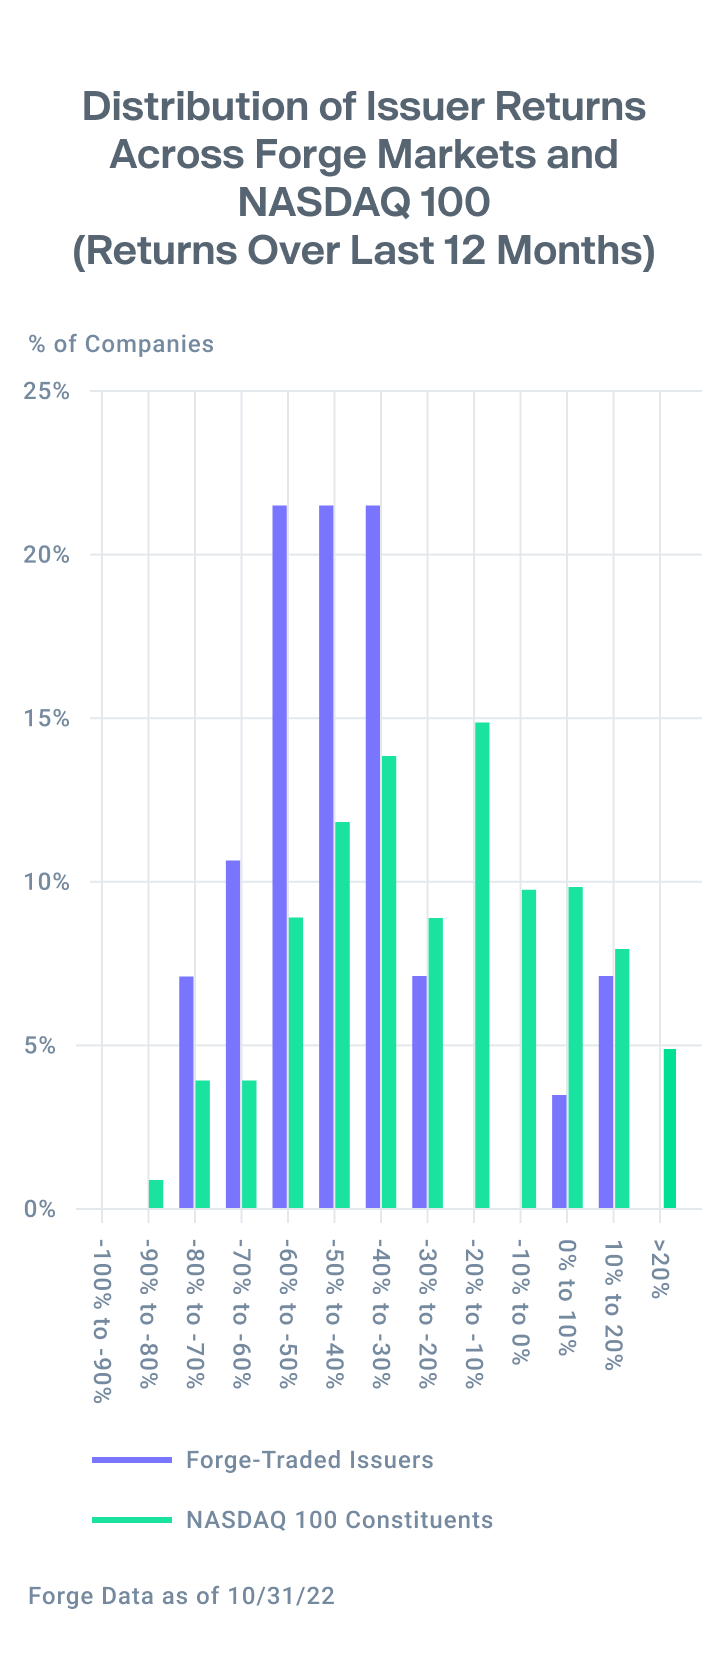
And beyond corporate characteristics, companies that traded on both markets showed some performance similarities over the past 12 months. In both markets, the vast majority of companies are trading down: 77% of the names on the NASDAQ 100 have negative returns compared to 89% for Forge Markets.7
Primary fundraising valuations remain resilient
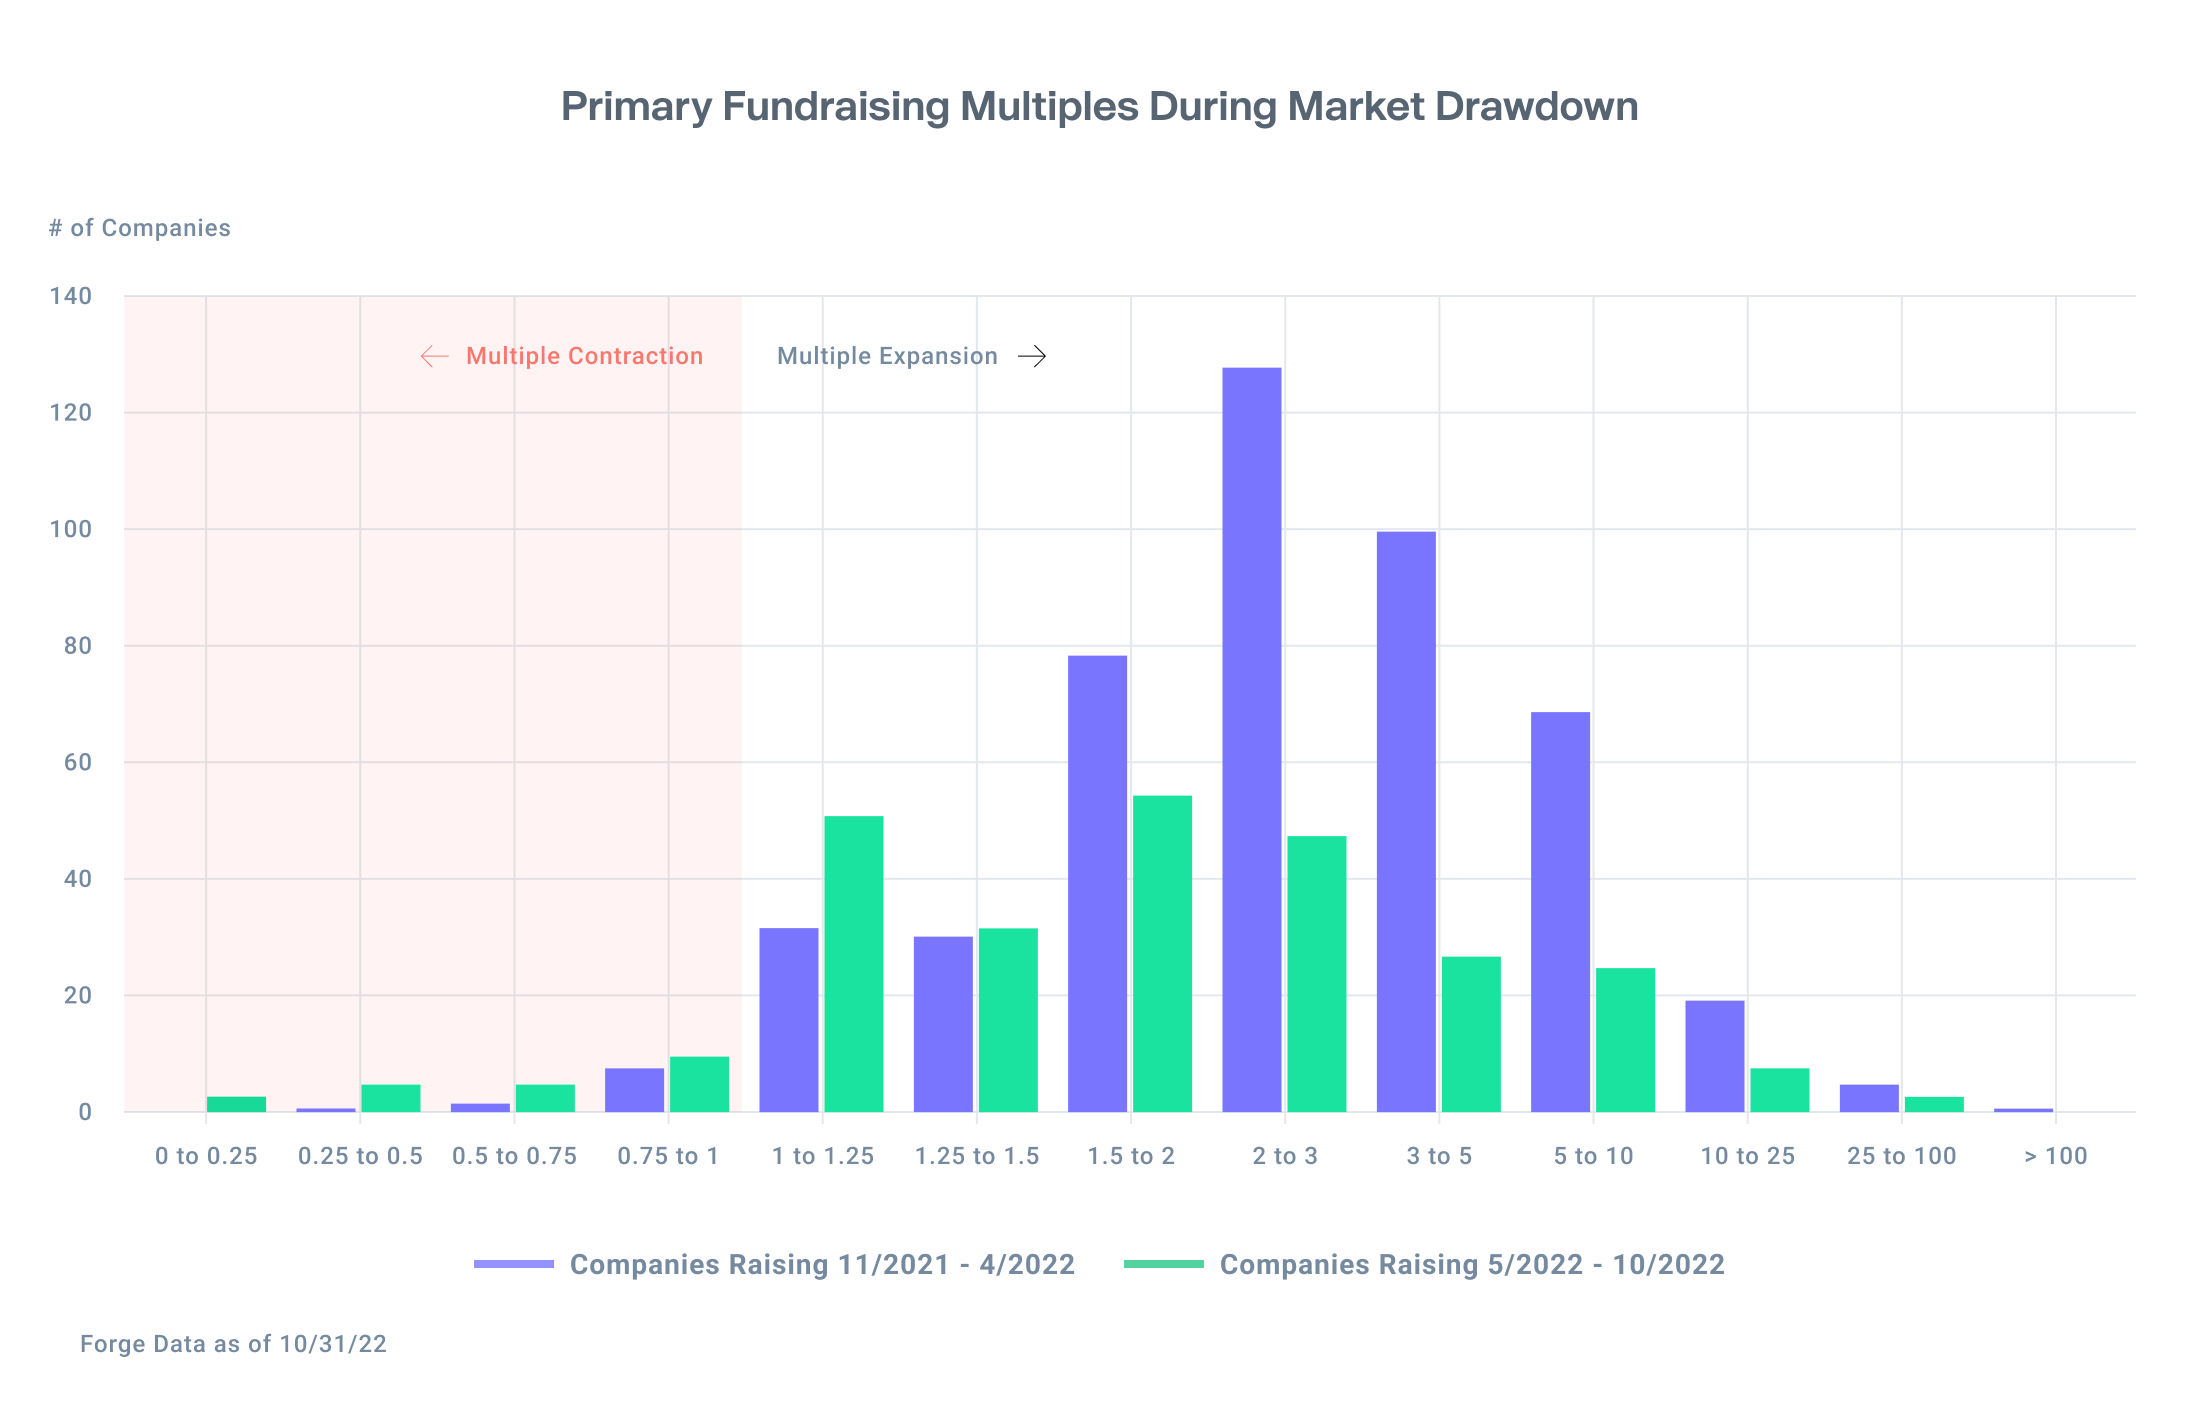
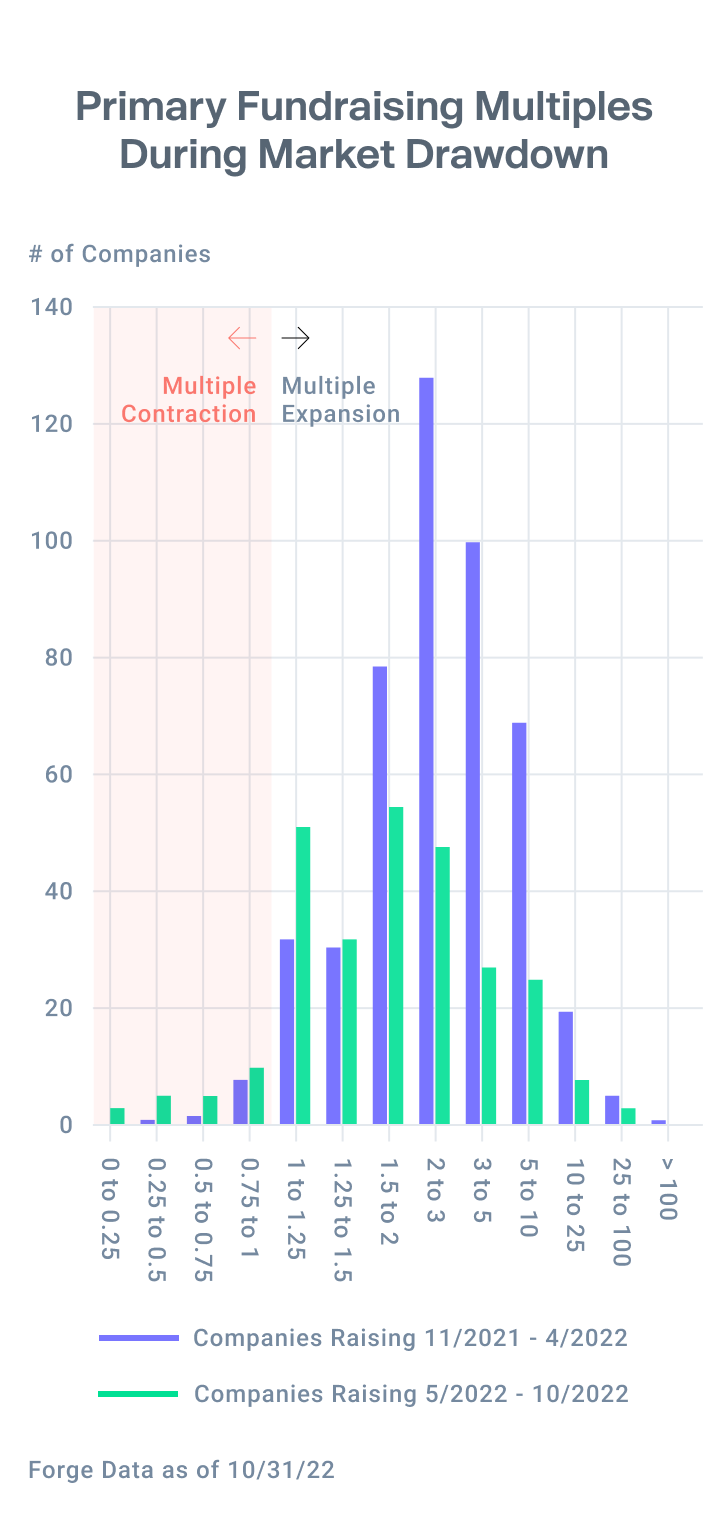
Forge Data tracks primary funding rounds for nearly 2,000 private companies. Since the market drawdown began in November 2021, over 700 of these companies raised primary rounds with the average raise at a 3.78X multiple to their last round.
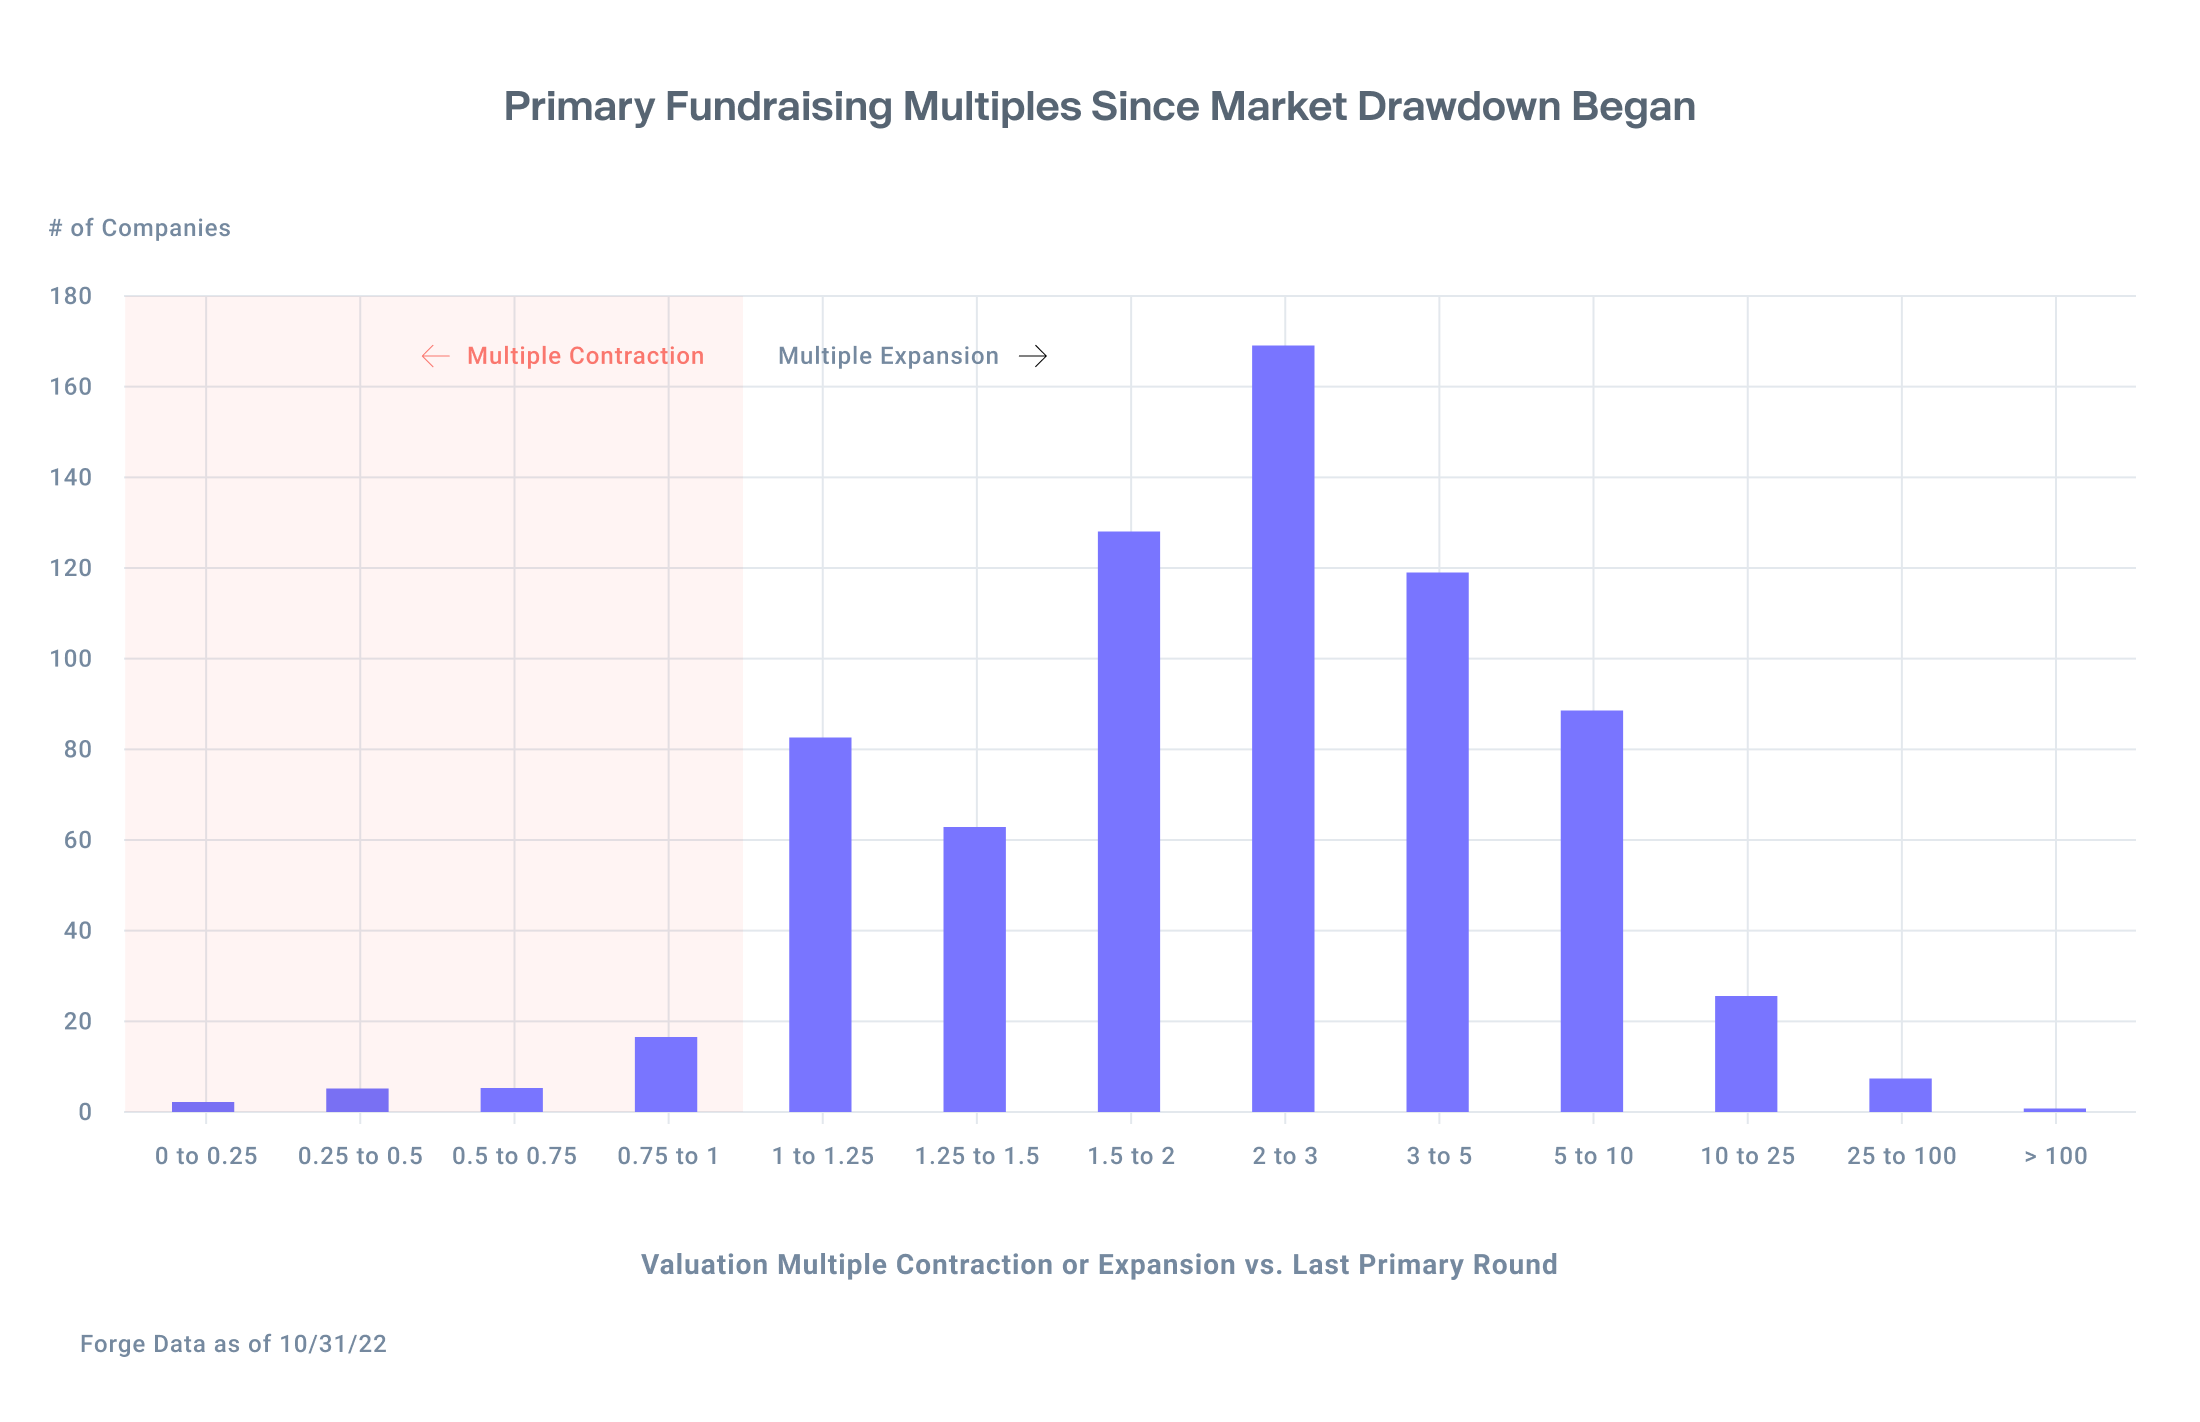
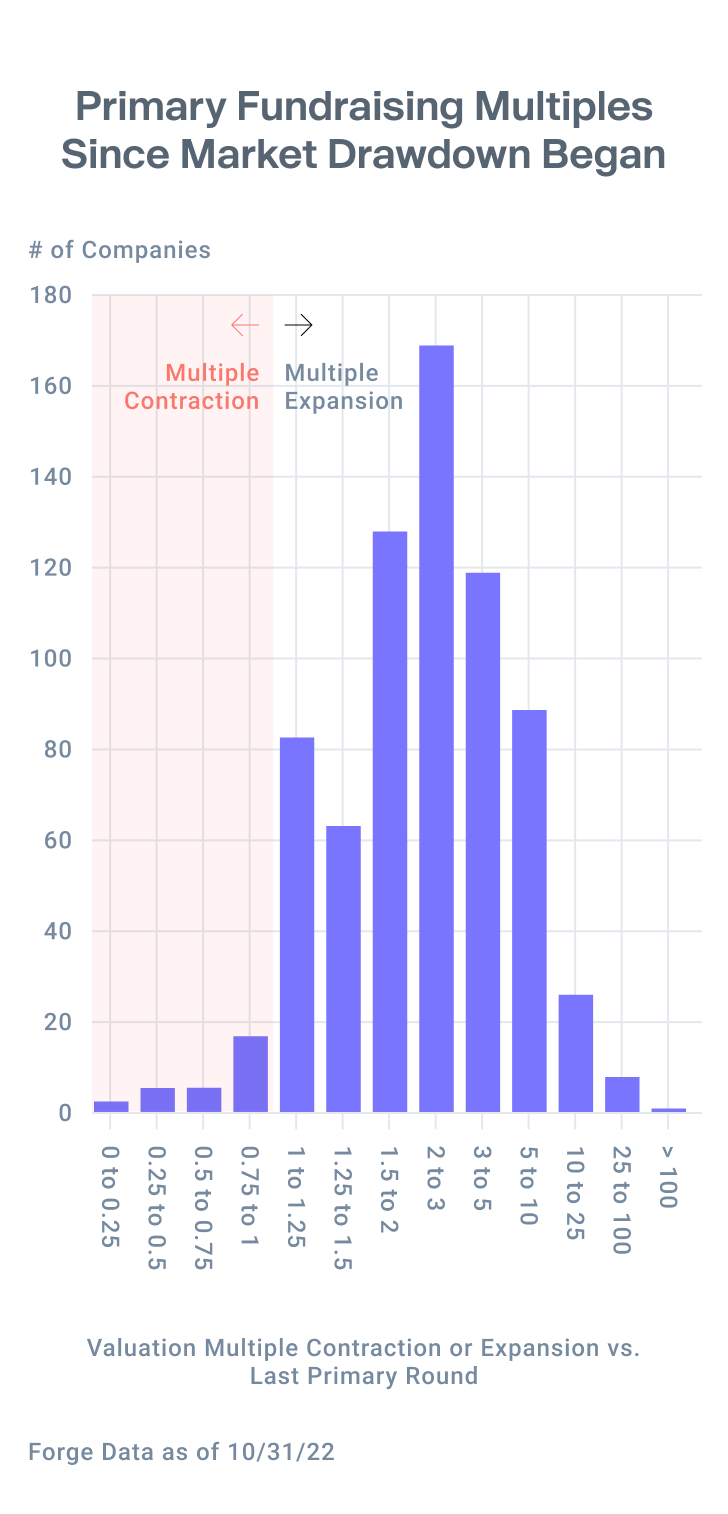
Breaking this data down a bit further, a clear trend emerges when comparing companies that raised money during the first six months of the drawdown (November 2021 – April 2022) versus the next six months of the drawdown (May 2022 – October 2022).
Companies who tapped the capital markets at the beginning of the sell-off were better able to avoid down-rounds and secure larger increases in their valuation. This may be because fundraising terms were agreed before the sell-off began, or because the impact of the sell-off had not fully wound its way through the venture capital ecosystem.
In the most recent six-month period, companies were more prone to down-rounds, smaller increases in their valuations, and investor-friendly terms.
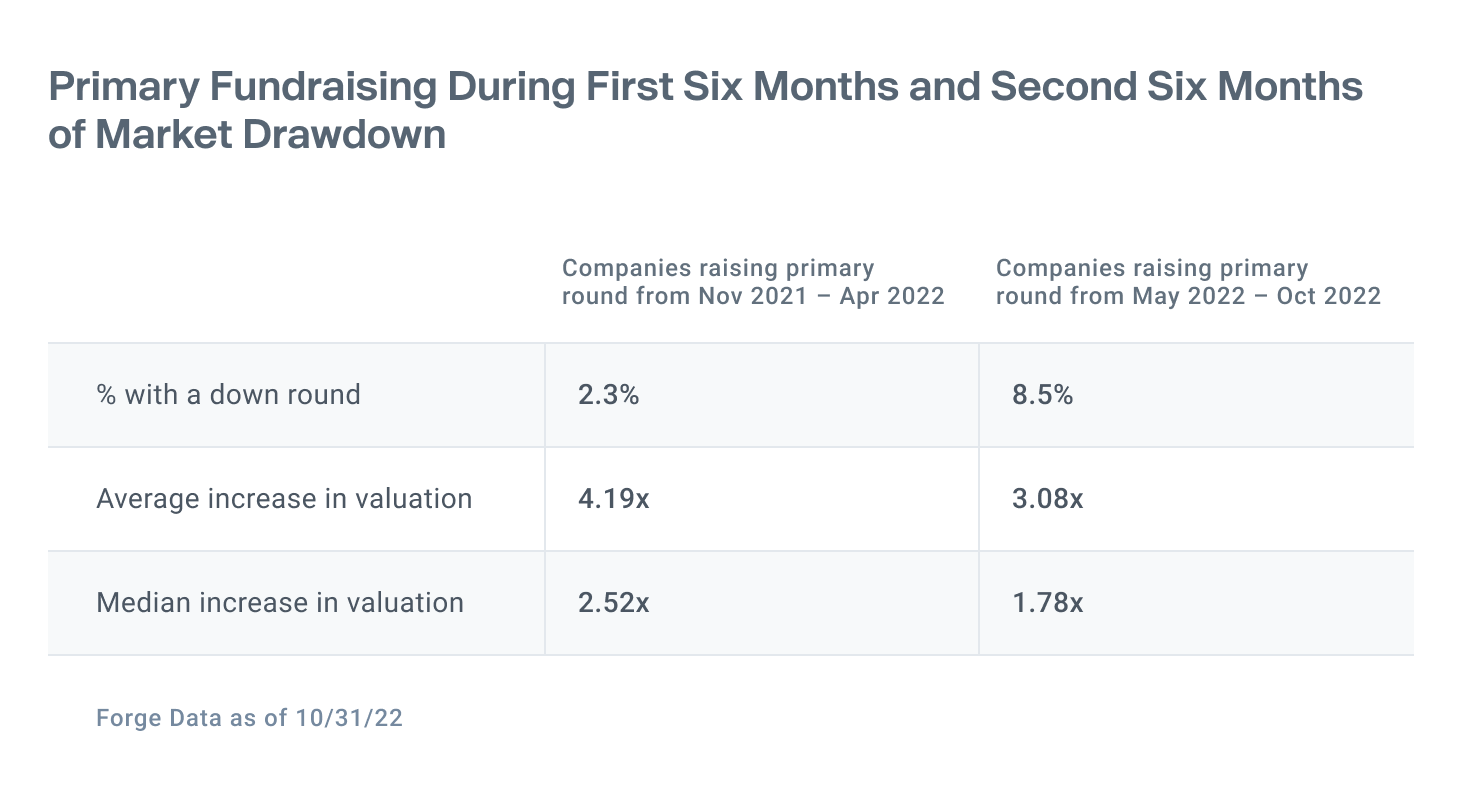
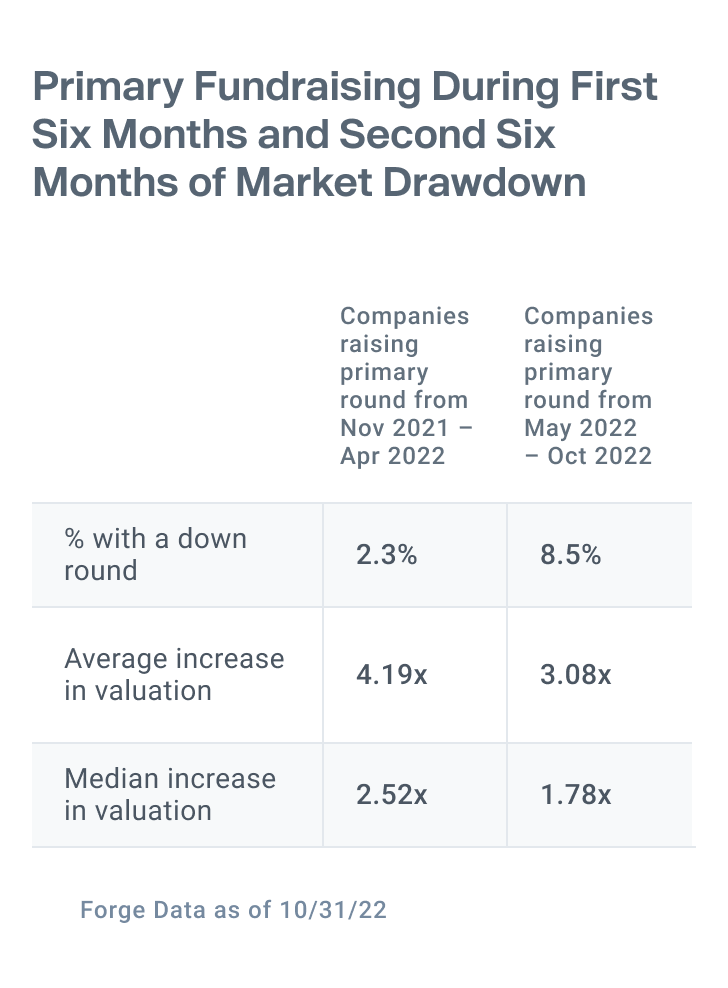
While the number of down rounds has not increased dramatically, valuation increases have clearly scaled back. Six months ago, companies were routinely raising money at a 2-3X multiple. Now, it’s more common for companies to raise at a 1.5-2X multiple.
Investment Giants reveal clues about Private Market valuations
Mutual fund marks are an increasingly important data source that can shed light on the valuation and direction of private companies. Many of the largest fund managers, such as Fidelity, BlackRock, Franklin Templeton, and T. Rowe Price, own shares of private companies in their portfolios and are required to report the value of each of their private company holdings quarterly, and in some cases, monthly.
Forge Data tracks these marks and enables investors to analyze them for the purposes of marking to market their own portfolios or making new investment decisions. This can be especially helpful as investors look to these investment giants for insight, given they may have greater access to company financials and management.
Forge’s data set spans back to 2019, and investors can see a clear trend over the last year of mutual funds marking more holdings at a discount to their last primary fundraising round. These discounts are yet to broach the same levels as they did at the height of the COVID-19 pandemic, when nearly 70% of portfolio companies were marked at a discount. In Q3 2022, mutual fund managers marked 38% of companies at a premium or at the same level as their last funding round.
Buy-Side opportunities persist as favorable inflation data finally emerges
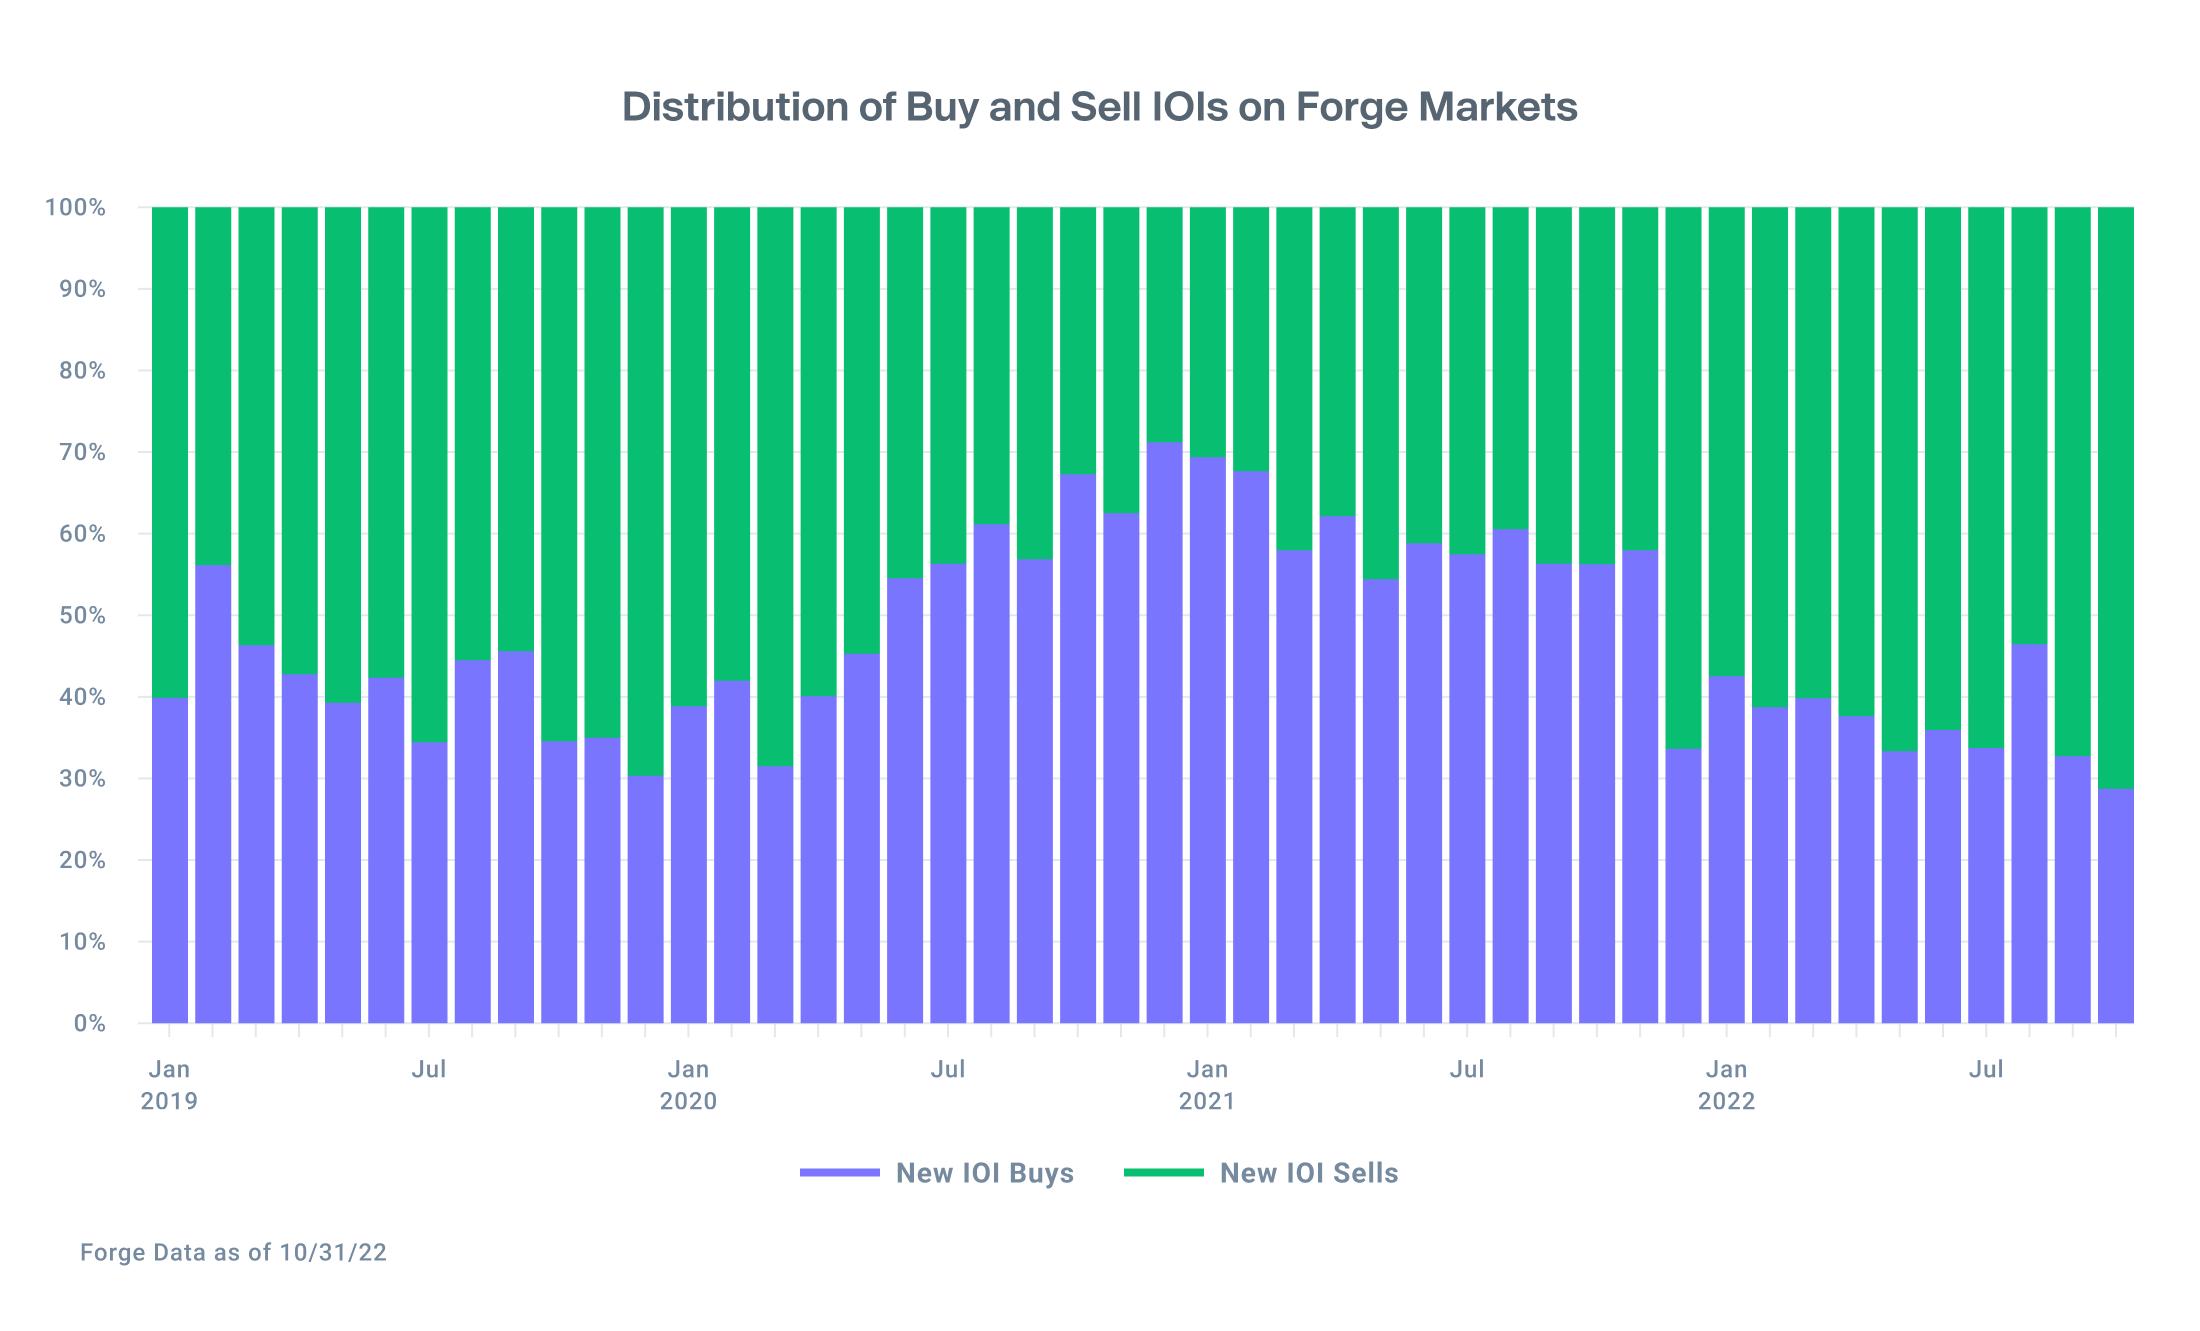
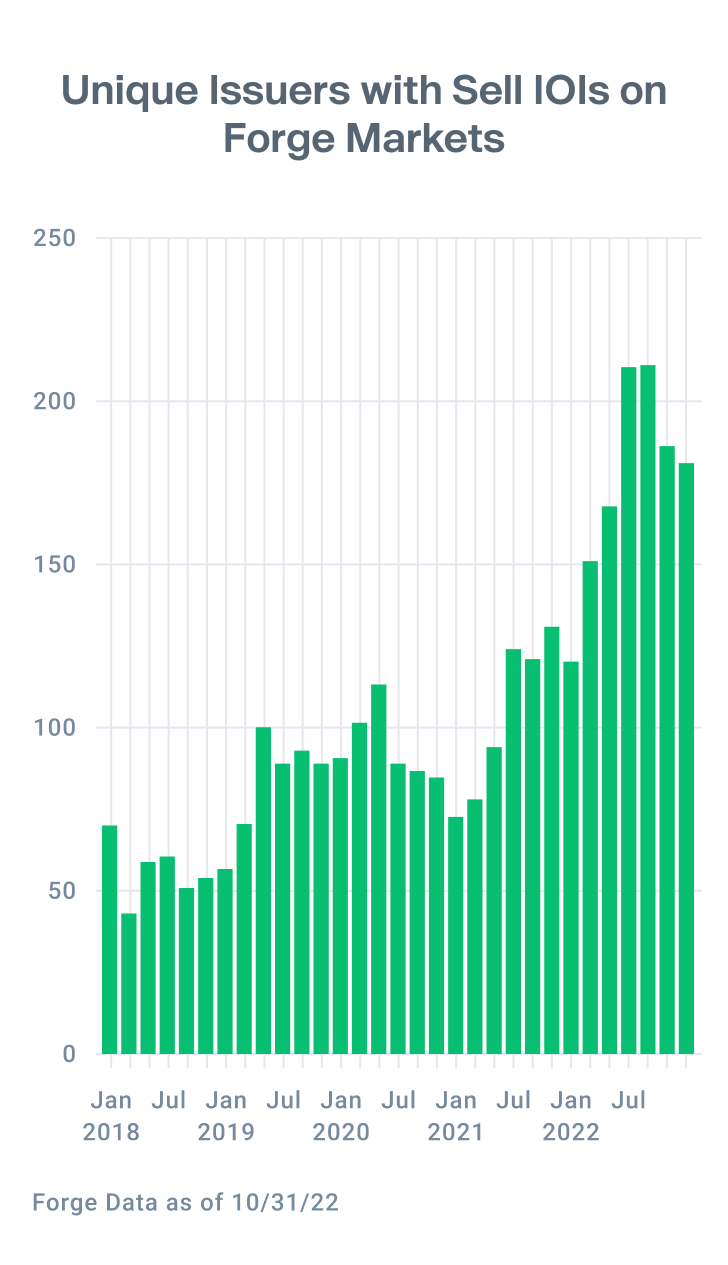
The number of unique companies with sell-side interest has remained roughly consistent, with approximately 180-200 distinct companies represented each month on the Forge platform since mid-Q1.
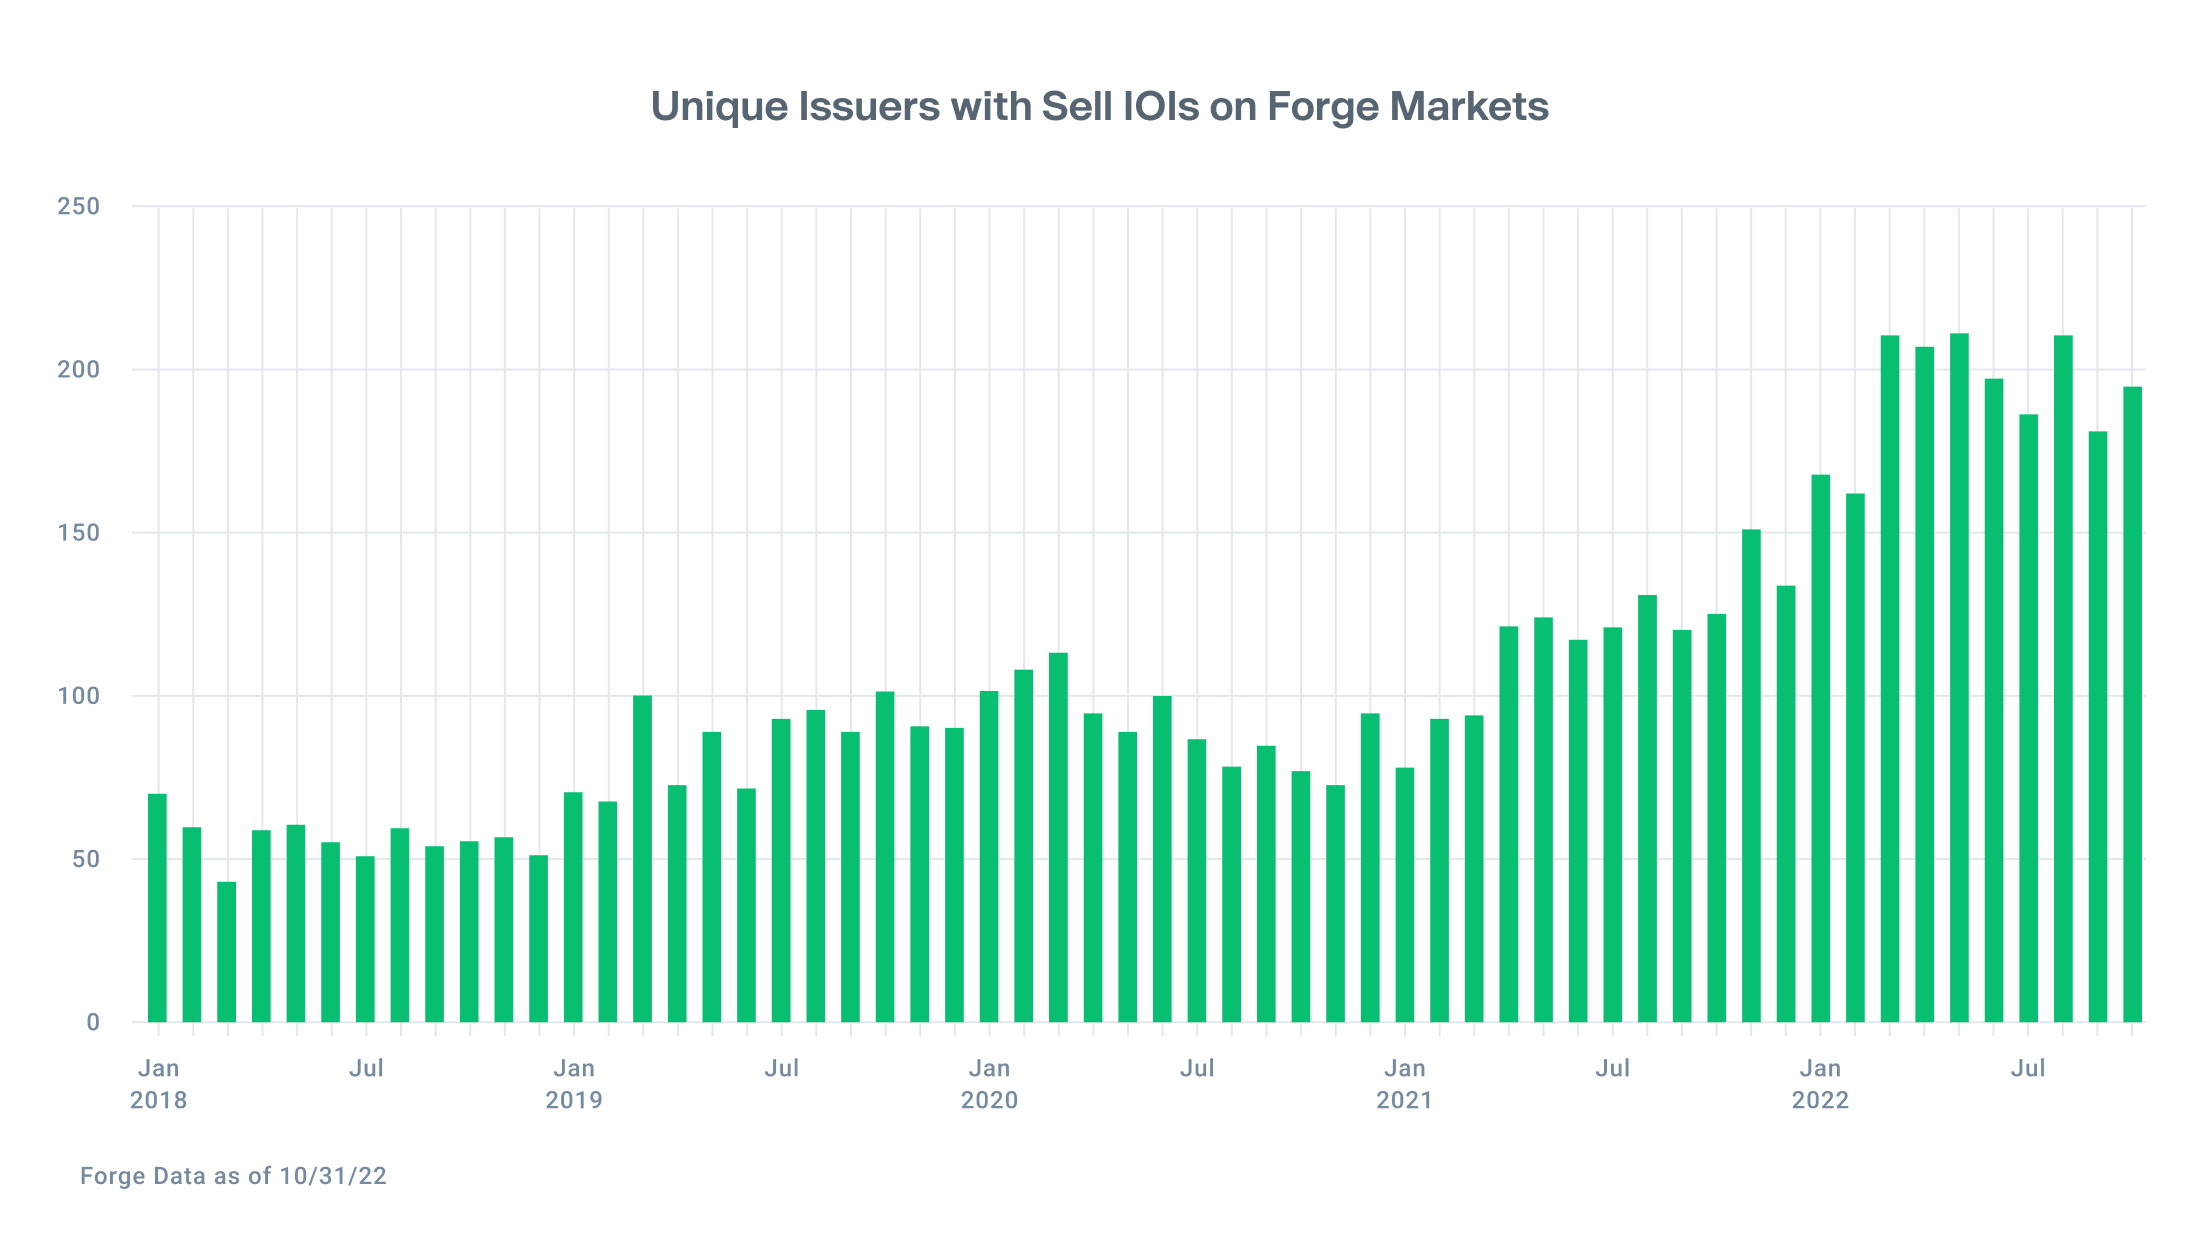
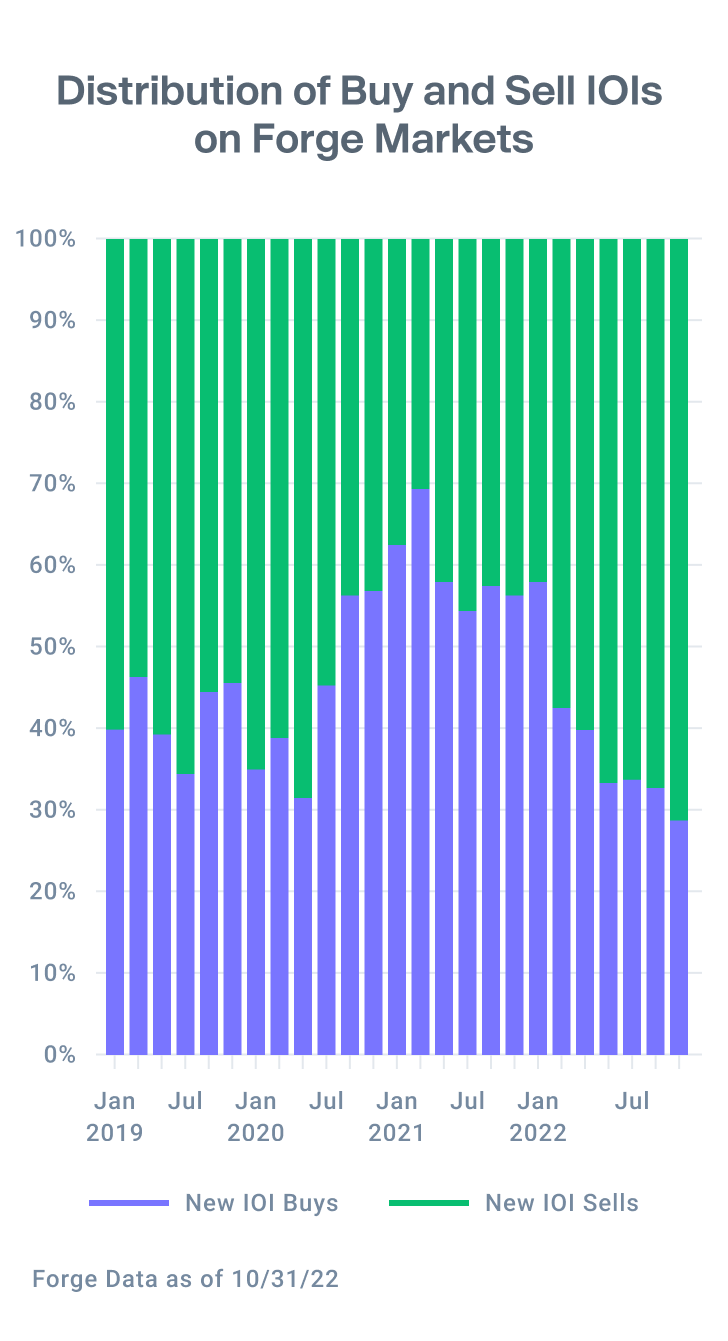
As has been the case since the beginning of the year, indications of interest on the Forge Markets platform remain skewed to the sell-side. These levels have remained relatively consistent since January 2022, with sell offers comprising roughly 55-70% of platform activity. Notably, buy activity ticked up in August as public markets rallied. With inflation data showing positive signs for the first time in nearly 18 months, investors will no doubt keep a keen eye on whether that trend emerges again as 2022 draws to a close.
